|
Journal of Environmental
Management (1987) 24, 17-28
Katalin
E. Fekete and Dezső J. Szepesi:
Simulation
of Atmospheric Acid Deposition on a Regional Scale
Extended summary
A regional scale
operational model for the simulation of air and precipitation quality
is presented. The aim of the simulation is to determine, quantitatively,
the complex effects of the following: source strength of sulphur
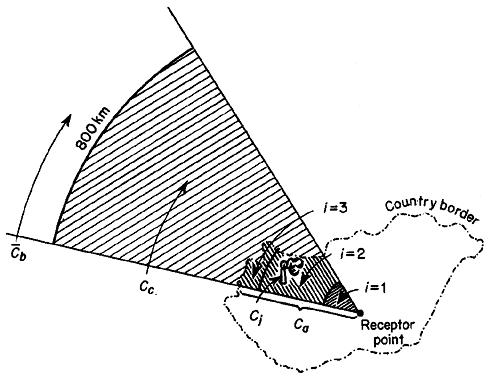
and nitrogen oxides (Figure 1.), effective height of the source,
wind pattern in the transport layer, mixed layer height, precipitation,
transformation, wet and dry deposition, and hemispheric background
values of air (Table 1.) and precipitation quality.

Figure 1.
Sector zones for which average emission densities were determined
|
Compounds
|
Background, microgram/cubic m
|
|
Sulphur dioxide (in sulphur)
|
1.2
|
|
Particulate sulphate (in sulphur)
|
1.0
|
|
Nitrogen dioxide (in nitrogen)
|
0.4
|
|
Particulate nitrate (in nitrogen)
|
0.05
|
|
Nitric acid gas (in nitrogen)
|
0.05
|
Table 1.
Hemispheric background for sulphur and nitrogen compounds for
Europe
The
model presents a regional scale territorial distribution of sulphur
dioxide (Figure 2.), nitrogen dioxide, particulate sulphate and
nitrate, nitric acid gas and precipitation sulphate and nitrate.
The total deposition is also expressed as maximal atmospheric acid
stress.

Figure 2.
Annual average sulphur dioxide concentrations (microgram S/cubic
m) in the ambient air originating from domestic area sources (a),
domestic tall stacks (b), and foreign sources (c), 1978-82
The first-generation
model estimates annual average concentrations and depositions, and
it is validated by 5 years of data from Regional Background Pollution
Station in Hungary (Table 2.).
| |
Compounds
|
Estimated
|
Measured
|
|
Concentration
(microgram/cubic m)
|
Sulphur dioxide (in sulphur) |
7.4
|
7.4
|
| Particulate sulphate (in sulphur) |
2.7
|
2.3
|
| Nitrogen dioxide (in nitrogen) |
2.3
|
2.3
|
| Particulate nitrate(in nitrogen) |
0.5
|
0.5
|
| Nitric acid gas (in nitrogen) |
0.5
|
0.6
|
|
Wet deposition
(gram/square m/year)
|
Sulphate (in sulphur) |
0.93
|
0.95
|
Nitrate (in nitrogen)
|
0.36
|
0.28
|
Table 2.
Estimated and measured annual average concentration and deposition
values for the Regional Background Pollution Station at K-puszta
(1978-82)

|