|
Proceedings
of the Fourth International Clean Air Congress,
Tokyo, Japan 1978, 284-287
Szepesi D. J.:
Modified
roll-back model for air quality planning
Summary of major findings
For the quantitative
analysis and forecasting of the quality of ambient air proper tools
are necessary. Such tools are meteorological simulation models.
In this paper an advanced version of a simple roll-back model reported
by Moris and Slater (1974) is presented.
This model is
based on the following principle of proportionality: The quality
of air to be attained in the n-th year in an emission control area
is proportional to the air quality measured in the initial year
as well as the quality of air calculated for the n-th year is proportional
to the air quality calculated for the initial year. The above principle
of proportionality is expressed by the following algorythm:
[khi(yn)-khi(b)]goal
/ [khi(0ym)-khi(b)]meas. =
sum
(i=1...4) {[khi/Q]ni * Q(ni)}calc. / sum (i=1...4) {[khi/Q]0i *
Q(0i)}calc.,
where
khi(yn) [microgram/cubic
m] - the yearly air quality norm value,
khi(b) [microgram/cubic m] - value of background concentration,
khi(0ym) [microgram/cubic m] - yearly mean value of air quality
measured
in the emission control area,
index i of the source category is: 1 ground level source, 2 area
source,
3 point source, 4 tall stack,
Q(ni) and Q(0i) [t/year] - emission of the i-th source category
in the n-th and the initial year, respectively,
[khi/Q]ni and [khi/Q]0i [microgram/cubic m/t/year] - relative
concentration value of
the i-th source category
in the n-th and the initial year, respectively.
Relative
concentration
|
for
ground level:
|
[khi/Q]
(n=0, i=1) = [C1(Z-1.5)M] / [D(uz+0.5)Z x] |
|
for
area source:
|
[khi/Q]
(n=0, i=2) = C2 M / uz T |
|
for
point source:
|
[khi/Q]
(n=0, i=3) = C3 M / [pi e uh sigma(y).sigma(z) N] |
|
for
tall stack:
|
[khi/Q]
(n=0, i=4) = C4 M / [pi e uh sigma(y).sigma(z) N] |
where
C1=7, C2 =30.72
empirical constants,
C3=0.002, C4=0.0006 conversion factors of the one hour maximum
concentration value into yearly average for the whole control
area,
M=31700 conversion factor,
Z [m] average height of buildings,
D [m] average width of the main road,
uz, uh [m/s] mean wind speed value at the roof top and at the
average height of the chimneys,
x [m] length of the main roads in the control area,
T [square m] area of the emission control region,
N number of industrial establishments having point sources in
the control area,
sigma(y).sigma(z) [square m] product of the horizontal and vertical
crosswind components of atmospheric dispersion for normal stratification
of the atmosphere, which can be determined by the aid of Figure
1b,
h [m] average height of the chimneys in the emission control area.
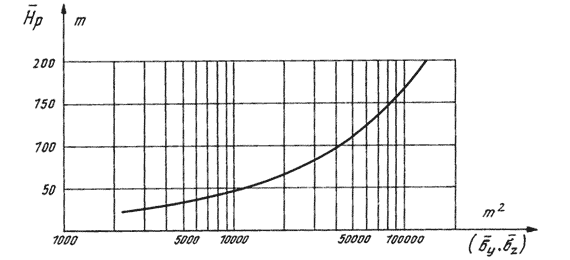
Figure 1b.
Product of sigma(y) and sigma(z) against the height of the source
The model presented
gives a good approximation if the following conditions fulfilled:
a) The measured
air quality data are characteristic for emission control area.
b) The value of background concentration remains unchanged.
c) The diffusion climatological factors will not change during
the period investigated.
The model presented
takes into account the simultaneous polluting effects of different
source categories. According to example shown here, the most intensive
pollution is due to ground level sources as well as area sources.
A much less effect is caused to the ambient air by point sources
and tall stacks. The comparison of the relative concentration values
for the 4 source categories gives the following ratios of the polluting
effectiveness:
Ground level
s. : Area s. : Point s. : Tall s. = 500 : 300 : 3 : 1.
References
Morris, R. et
al., Modified Rollback Models. Proc. 5th Expert Meeting on Air Pollution
Modelling. Comitteee on the Challenges to Modern Society, Denmark
(1974).

|